
The West Coast’s current boost has no dependable end date: import shares show a shifting balance, not a permanent winner. Los Angeles and Long Beach handled 33% of U.S. container imports in 2023, down from 50% 20 years earlier. That change makes the pros and cons of West Coast versus East Coast ports a practical routing question, not a simple contest with one lasting answer.
If you’re seeing more freight move through East Coast ports, it’s reasonable to ask whether that shift will continue. The answer depends on more than port popularity: Panama Canal transit, terminal capacity, congestion, and the final destination of your goods all affect which coast makes sense.
This article explains the factors shaping the current West Coast advantage, what import-share trends can reveal, and why congestion may shift rather than disappear. You’ll get a clearer way to weigh the trade-offs for your shipments and assess what could extend or reduce the West Coast boost.
Key Takeaways
- Assess how Panama Canal transit and East Coast infrastructure can reshape routing options for Asian imports.
- Look beyond coast-wide averages: congestion can shift between ports and affect how quickly cargo moves inland.
- Use changing import shares to understand why the West Coast’s advantage may fluctuate rather than last indefinitely.
- Match port choice to your cargo’s origin and destination, then consider how freight logistics and customs clearance can support the route.
Panama Canal transit and East Coast infrastructure
The Panama Canal expansion in 2016 allowed larger vessels to transit the route, widening options for Asian cargo bound for Atlantic ports. East Coast ports also dredged channels in anticipation of larger container ships. Even so, Asian imports through East Coast ports generally remain below West Coast volumes.
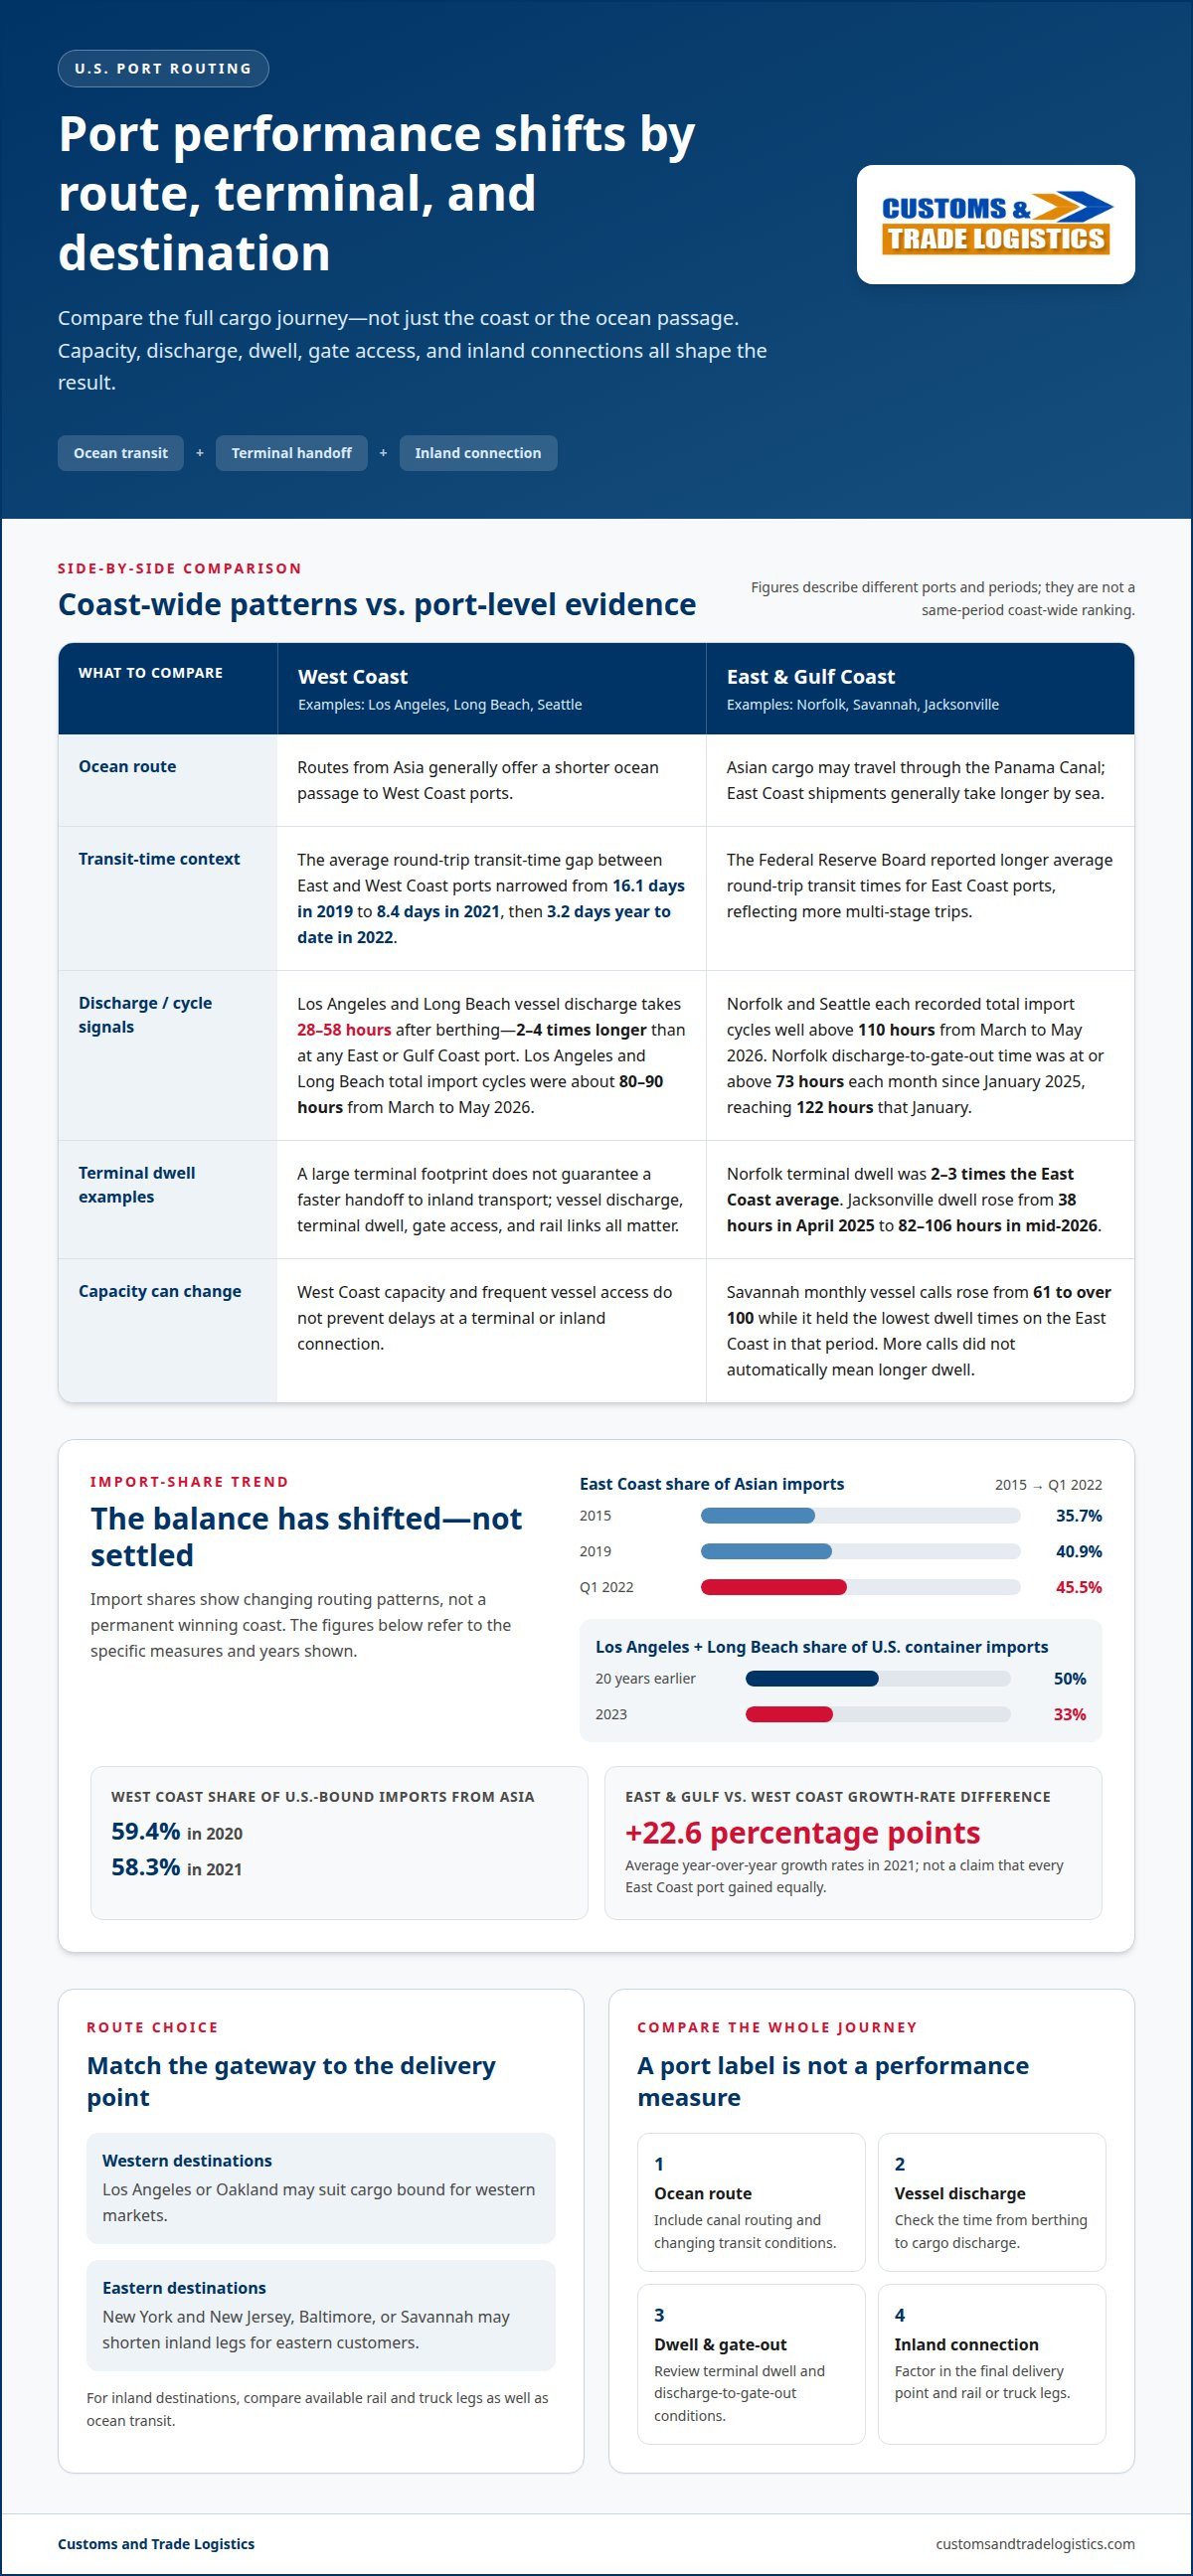
How do transit times from Asian ports compare? West Coast routes generally offer a shorter ocean passage, while East Coast shipments may travel through the Panama Canal and take longer. According to the Federal Reserve Board, East Coast ports have longer average round-trip transit times than West Coast ports, reflecting more multi-stage trips. The gap narrowed from 16.1 days in 2019 to 8.4 days in 2021, then to 3.2 days year to date in 2022.
Transit conditions can shift quickly. Average transit times increased from 60 days in 2020 to 91 days in 2021. Canal constraints can affect vessel schedules, while Red Sea disruptions can prompt carriers to adjust routes and arrival plans. For importers, the practical step is to compare the full route to the cargo’s destination, not just the sailing leg. A shorter voyage to Los Angeles may be less useful if the delivery point is on the Atlantic coast.
How do labor costs, union rules, and operating hours compare? There is no single coast-wide rate or schedule for every terminal. Costs, labor arrangements, and operating windows vary by port and terminal, so compare the specific origin, destination, and handling plan for your shipment.
Capacity limits and shifting congestion
Port capacity is more than the number of container berths. Vessel unloading, terminal dwell, gate access, and rail connections all affect how quickly cargo reaches the supply chain. At the Ports of Los Angeles and Long Beach, vessel discharge takes 28 to 58 hours after berthing. That process takes two to four times longer than at any East or Gulf Coast port. A large terminal footprint therefore doesn’t guarantee a faster direct handoff to inland transport.
Congestion can shift, rather than simply disappear. Norfolk’s discharge-to-gate-out time remained at or above 73 hours each month since January 2025, reaching 122 hours in January 2025. Norfolk’s terminal dwell was two to three times the East Coast average. These figures show why a port’s coast-wide label can’t replace a terminal-level view. Importers need to consider the full container journey, including the time between vessel discharge and gate exit.
Savannah offers a different capacity signal. Its monthly vessel calls rose from 61 to over 100 while it held the lowest dwell times on the East Coast. Higher call volume did not automatically mean longer dwell in that period. By contrast, Jacksonville’s terminal dwell rose from 38 hours in April 2025 to a range of 82 to 106 hours in mid-2026. Port performance can change as calls, terminal activity, and inland movement interact.
Recent import-cycle figures reinforce the point. From March to May 2026, Norfolk and Seattle each recorded total import cycles well above 110 hours. Los Angeles and Long Beach recorded cycles of about 80 to 90 hours. The largest port may offer frequent vessel access, but a delay at one stage can reshape the schedule. Panama Canal routing and port expansion affect route choices; neither prevents congestion at terminals or inland connections. For a resilient plan, compare current discharge, dwell, and gate-out conditions at the specific ports serving your origin and destination.
East and Gulf Coast versus West Coast import shares
Import shares show a changing balance, not a permanent winner. West Coast ports traditionally dominate Asian imports, but East Coast participation has grown. The East Coast handled 35.7% of Asian imports in 2015 and 40.9% in 2019. Its share reached 45.5% in the first quarter of 2022. These figures mark different periods, so they indicate a trend rather than a direct, same-year comparison.
West Coast volumes still matter. The West Coast handled 59.4% of U.S.-bound imports from Asia in 2020 and 58.3% in 2021. Los Angeles and Long Beach together handled 34.8% of total U.S.-bound seaborne imports in 2021. In 2023, those two ports handled 33% of U.S. container imports, down from 50% 20 years earlier. The change suggests importers are spreading activity across more gateways.
East and Gulf Coast ports’ average year-over-year growth rates were 22.6 percentage points higher than West Coast ports in 2021. That growth can reflect rerouting, destination demand, and available capacity. It doesn’t mean every East Coast port gained equally. Savannah, for example, recorded a 10.3% year-over-year decline in monthly container volume in November 2023. One port’s recent movement shouldn’t stand in for a whole coast.
How do shipping costs and port fees compare? There is no single coast-wide cost. Ocean routing, port charges, inland distance, and transport mode all affect the total. Compare the full route to the final delivery point, not just the vessel’s arrival port.
Rail and truck connections also depend on the destination. West Coast gateways may suit cargo bound for western markets, while East Coast ports can shorten inland legs for eastern customers. Match the port to the delivery address: Los Angeles or Oakland for western destinations, and New York and New Jersey, Baltimore, or Savannah for eastern markets. The U.S. Environmental Protection Agency lists these among major U.S. ports. For inland destinations, compare available rail and truck legs as well as ocean transit.
What are the major West Coast and East Coast ports in the United States?
The U.S. Environmental Protection Agency lists Los Angeles, Long Beach, Oakland, New York and New Jersey, Baltimore, Savannah, and New Orleans among major ports. Houston is another significant Gulf Coast gateway. Each serves different regions, so the practical choice depends on cargo origin, final destination, vessel access, and inland connections.
On the West Coast, Los Angeles and Long Beach anchor container traffic, with Oakland serving Northern California. Los Angeles handled 8.63 million TEUs in 2023, while Long Beach handled 8.02 million TEUs. Their listed draft depths are greater than 52 feet and greater than 50 feet, respectively. Seattle’s draft depth is 50 feet. These figures help describe vessel access, but they don’t alone determine cargo’s total journey time.
East and Gulf Coast options include New York and New Jersey, Baltimore, Savannah, Charleston, Houston, and New Orleans. Port Newark-Elizabeth Marine Terminal has a 50-foot draft depth. Baltimore’s terminals serve a Mid-Atlantic gateway, while Savannah and Charleston connect importers with southeastern markets. Savannah recorded 4.5 million TEUs through November 2023. Charleston’s draft depth is 52 feet; Houston’s is 45 feet.
Match the gateway to the delivery region before comparing port capacity. Los Angeles or Long Beach may suit western destinations; New York and New Jersey or Baltimore may be practical for northeastern markets. Savannah and Charleston are options for southeastern cargo, while Houston and New Orleans serve Gulf Coast routes. Then compare inland rail and truck legs, terminal handling, and the shipment’s arrival schedule. Deep channels and high container volumes are only part of the route decision.
For a route plan that connects port choice with inland delivery, plan your import route around the shipment’s origin and destination.
Customs and Trade Logistics: Import From China Consulting
Customs and Trade Logistics helps importers connect port choice with the wider China import process. Import From China Consulting supports planning around cargo origin, intended U.S. destination, and transport and handling needs. This can help when comparing West Coast and East Coast gateways, especially if changing ports affects inland delivery or shipment coordination.
After selecting a route, International Freight Logistics can support the movement plan, while Customs Clearance Services handle the customs clearance stage. Delivery and Redistribution Services can help move goods onward after arrival. Coordinating these steps helps manage the handoffs between overseas transport, port arrival, clearance, and final delivery.
For help planning an import route from China, contact Customs and Trade Logistics.
Build a Port Strategy That Can Adapt
A port decision works best as part of a repeatable routing plan, not a one-time bet on a coast. As suppliers, customer locations, or delivery priorities change, reassess which gateway fits each shipment and how cargo will reach its destination. This gives your team a practical basis for weighing the pros and cons of West Coast versus East Coast ports without assuming today’s advantage will last.
Customs and Trade Logistics supports the next steps through Import From China Consulting, International Freight Logistics, and Customs Clearance Services. Together, these services connect import planning with freight movement and clearance. Involve a logistics professional when a route decision affects how your goods enter the United States or reach their intended market.
Contact Customs and Trade Logistics to discuss your import plans. A clear route strategy can help your business move forward with greater confidence.
Frequently Asked Questions
West Coast ports see a boost, but for how long?
There is no reliable fixed end date for the West Coast boost. Port share can shift as carriers adjust routes, importers respond to congestion, and cargo destinations change. Rather than treating a temporary increase as a lasting trend, compare each shipment’s route and delivery needs. Weighing the pros and cons of West Coast versus East Coast ports is an ongoing planning decision.
How do port capacity, congestion, and vessel wait times compare by coast?
Conditions vary by terminal and shipment stage, so a coast-wide label can hide important differences. A vessel may wait offshore, spend time at berth, or encounter delays as a container moves through the terminal and out the gate. Available berth space, for example, does not guarantee quick inland movement. Compare vessel waits, terminal handling, and gate or rail access at the specific ports on your route.
How do Panama Canal, Suez Canal, and inland routes affect East Coast versus West Coast shipping?
Canal choice depends on vessel origin, carrier route, and destination. The Panama Canal can connect Asian services with East Coast ports, while Suez Canal routing may factor into services traveling through the Mediterranean and Atlantic. Disruptions can prompt carriers to reroute and change schedules. Inland rail and truck legs matter too: a longer ocean route may suit cargo whose final destination is closer to an East Coast gateway.
What are the risks of strikes, disruptions, and weather at ports on each coast?
Labor action, severe weather, and operational interruptions can affect ports on either coast, delaying vessel calls or cargo movement. Exposure depends on the port and timing, rather than a simple West-versus-East rule. For example, Florida’s hurricane season runs from June 1 through November 30. Importers can build flexibility into schedules and consider how a delay at one port would affect onward delivery.
How do customs processing, regulations, and cargo handling differ between U.S. coasts?
The coast alone does not determine customs processing. Shipment details, documentation, cargo classification, and any applicable government-agency review shape the process. Handling can also differ by terminal equipment and local procedures, so a container’s journey may vary from port to port. Customs and Trade Logistics offers Customs Clearance Services at U.S. ports, helping importers coordinate clearance around shipment-specific paperwork and handling needs.